很多时候,程序并不能直接展示本地文件中的数据,此时需要程序读取网络数据,并展示它们。
比如前面介绍的 http://lishi.tianqi.com 站点的数据,它并未提供下载数据的链接(前面程序所展示的 csv 文件本身就是使用程序抓取下来的)。在这种情况下,程序完全可以直接解析网络数据,然后将数据展示出来。
前面已经介绍了 Python 的网络支持库 urllib,通过该库下的 request 模块可以非常方便地向远程发送 HTTP 请求,获取服务器响应。因此,本程序的思路是使用 urllib.request 向 lishi.tianqi.com 发送请求,获取该网站的响应,然后使用 Python 的 re 模块来解析服务器响应,从中提取天气数据。
本程序将会通过网络读取 http://lishi.tianqi.com 站点的数据,并展示 2017 年广州的最高气温和最低气温。
import re
from datetime import datetime
from datetime import timedelta
from matplotlib import pyplot as plt
from urllib.request import *

# 定义一个函数读取lishi.tianqi.com的数据
def get_html(city, year, month):  #①
    url = 'http://lishi.tianqi.com/' + city + '/' + str(year) + str(month) + '.html'
    # 创建请求
    request = Request(url)
    # 添加请求头
    request.add_header('User-Agent', 'Mozilla/5.0 (Windows NT 10.0; WOW64)' +
        'AppleWebKit/537.36 (KHTML, like Gecko) Chrome/54.0.2840.99 Safari/537.36')
    response = urlopen(request)
    # 获取服务器响应
    return response.read().decode('gbk')

# 定义3个list列表作为展示的数据
dates, highs, lows = [], [], []
city = 'guangzhou'
year = '2017'
months = ['01', '02', '03', '04', '05', '06', '07',
    '08', '09', '10', '11', '12']
prev_day = datetime(2016, 12, 31)
# 循环读取每个月的天气数据
for month in months:
    html = get_html(city, year, month)
    # 将html响应拼起来
    text = "".join(html.split())
    # 定义包含天气信息的div的正则表达式
    patten = re.compile('<divclass="tqtongji2">(.*?)</div><divstyle="clear:both">')
    table = re.findall(patten, text)
    patten1 = re.compile('<ul>(.*?)</ul>')
    uls = re.findall(patten1, table[0])
    for ul in uls:
        # 定义解析天气信息的正则表达式
        patten2 = re.compile('<li>(.*?)</li>')
        lis = re.findall(patten2, ul)
        # 解析得到日期数据
        d_str = re.findall('>(.*?)</a>', lis[0])[0]
        try:
            # 将日期字符串格式化为日期
            cur_day = datetime.strptime(d_str, '%Y-%m-%d')
            # 解析得到最高气温和最低气温
            high = int(lis[1])
            low = int(lis[2])
        except ValueError:
            print(cur_day, '数据出现错误')
        else:
            # 计算前、后两天数据的时间差
            diff = cur_day - prev_day
            # 如果前、后两天数据的时间差不是相差一天,说明数据有问题
            if diff != timedelta(days=1):
                print('%s之前少了%d天的数据' % (cur_day, diff.days - 1))
            dates.append(cur_day)
            highs.append(high)
            lows.append(low)
            prev_day = cur_day
# 配置图形
fig = plt.figure(dpi=128, figsize=(12, 9))
# 绘制最高气温的折线
plt.plot(dates, highs, c='red', label='最高气温',
    alpha=0.5, linewidth = 2.0)
# 再绘制一条折线
plt.plot(dates, lows, c='blue', label='最低气温',
    alpha=0.5, linewidth = 2.0)
# 为两个数据的绘图区域填充颜色
plt.fill_between(dates, highs, lows, facecolor='blue', alpha=0.1)
# 设置标题
plt.title("广州%s年最高气温和最低气温" % year)
# 为两条坐标轴设置名称
plt.xlabel("日期")
# 该方法绘制斜着的日期标签
fig.autofmt_xdate()
plt.ylabel("气温(℃)")
# 显示图例
plt.legend()
ax = plt.gca()
# 设置右边坐标轴线的颜色(设置为none表示不显示)
ax.spines['right'].set_color('none')
# 设置顶部坐标轴线的颜色(设置为none表示不显示)
ax.spines['top'].set_color('none')
plt.show()

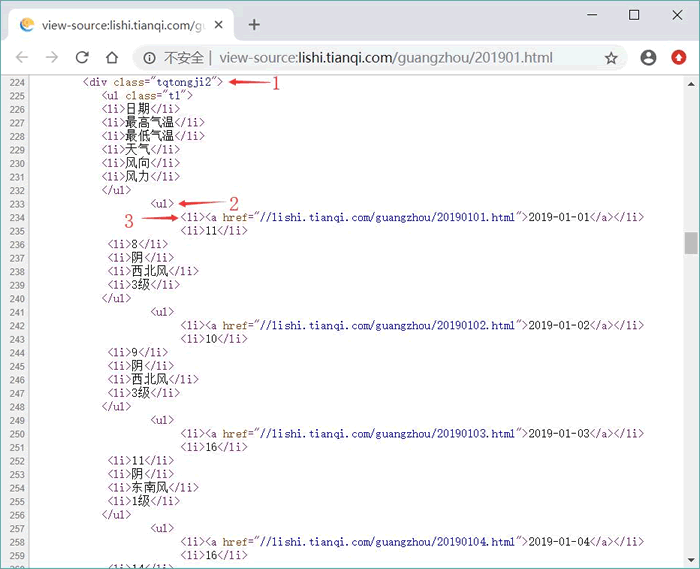
程序中第 32 行代码使用正则表达式来获取包含全部天气信息的 <div…/> 元素,即图 1 中数字 1 所标识的 <div…/> 元素。
程序中第 34 行代码使用正则表达式来匹配天气 <div…/> 中没有属性的 <ul…/> 元素,即图 1 中数字 2 所标识的 <ul…/> 元素。这样的 <ul…/> 元素有很多个,每个 <ul…/> 元素代表一天的天气信息,因此,上面程序使用了循环来遍历每个 <ul…/> 元素。
程序中第 38 行代码使用正则表达式来匹配每日天气 <ul…> 中的 <li…/> 元素,即图 1 中数字 3 所标识的 <li…/> 元素。在每个 <ul…/> 元素内可匹配到 6 个 <li…/> 元素,但程序只获取日期、最高气温和最低气温,因此,程序只使用前三个 <li…/> 元素的数据。
神龙|纯净稳定代理IP免费测试>>>>>>>>天启|企业级代理IP免费测试>>>>>>>>IPIPGO|全球住宅代理IP免费测试


